SYS // XAUUSD TERMINAL LIVE · 12:59 UTC
LIVE GOLD CHART

XAUUSD Live Chart – Live Gold Price in USD

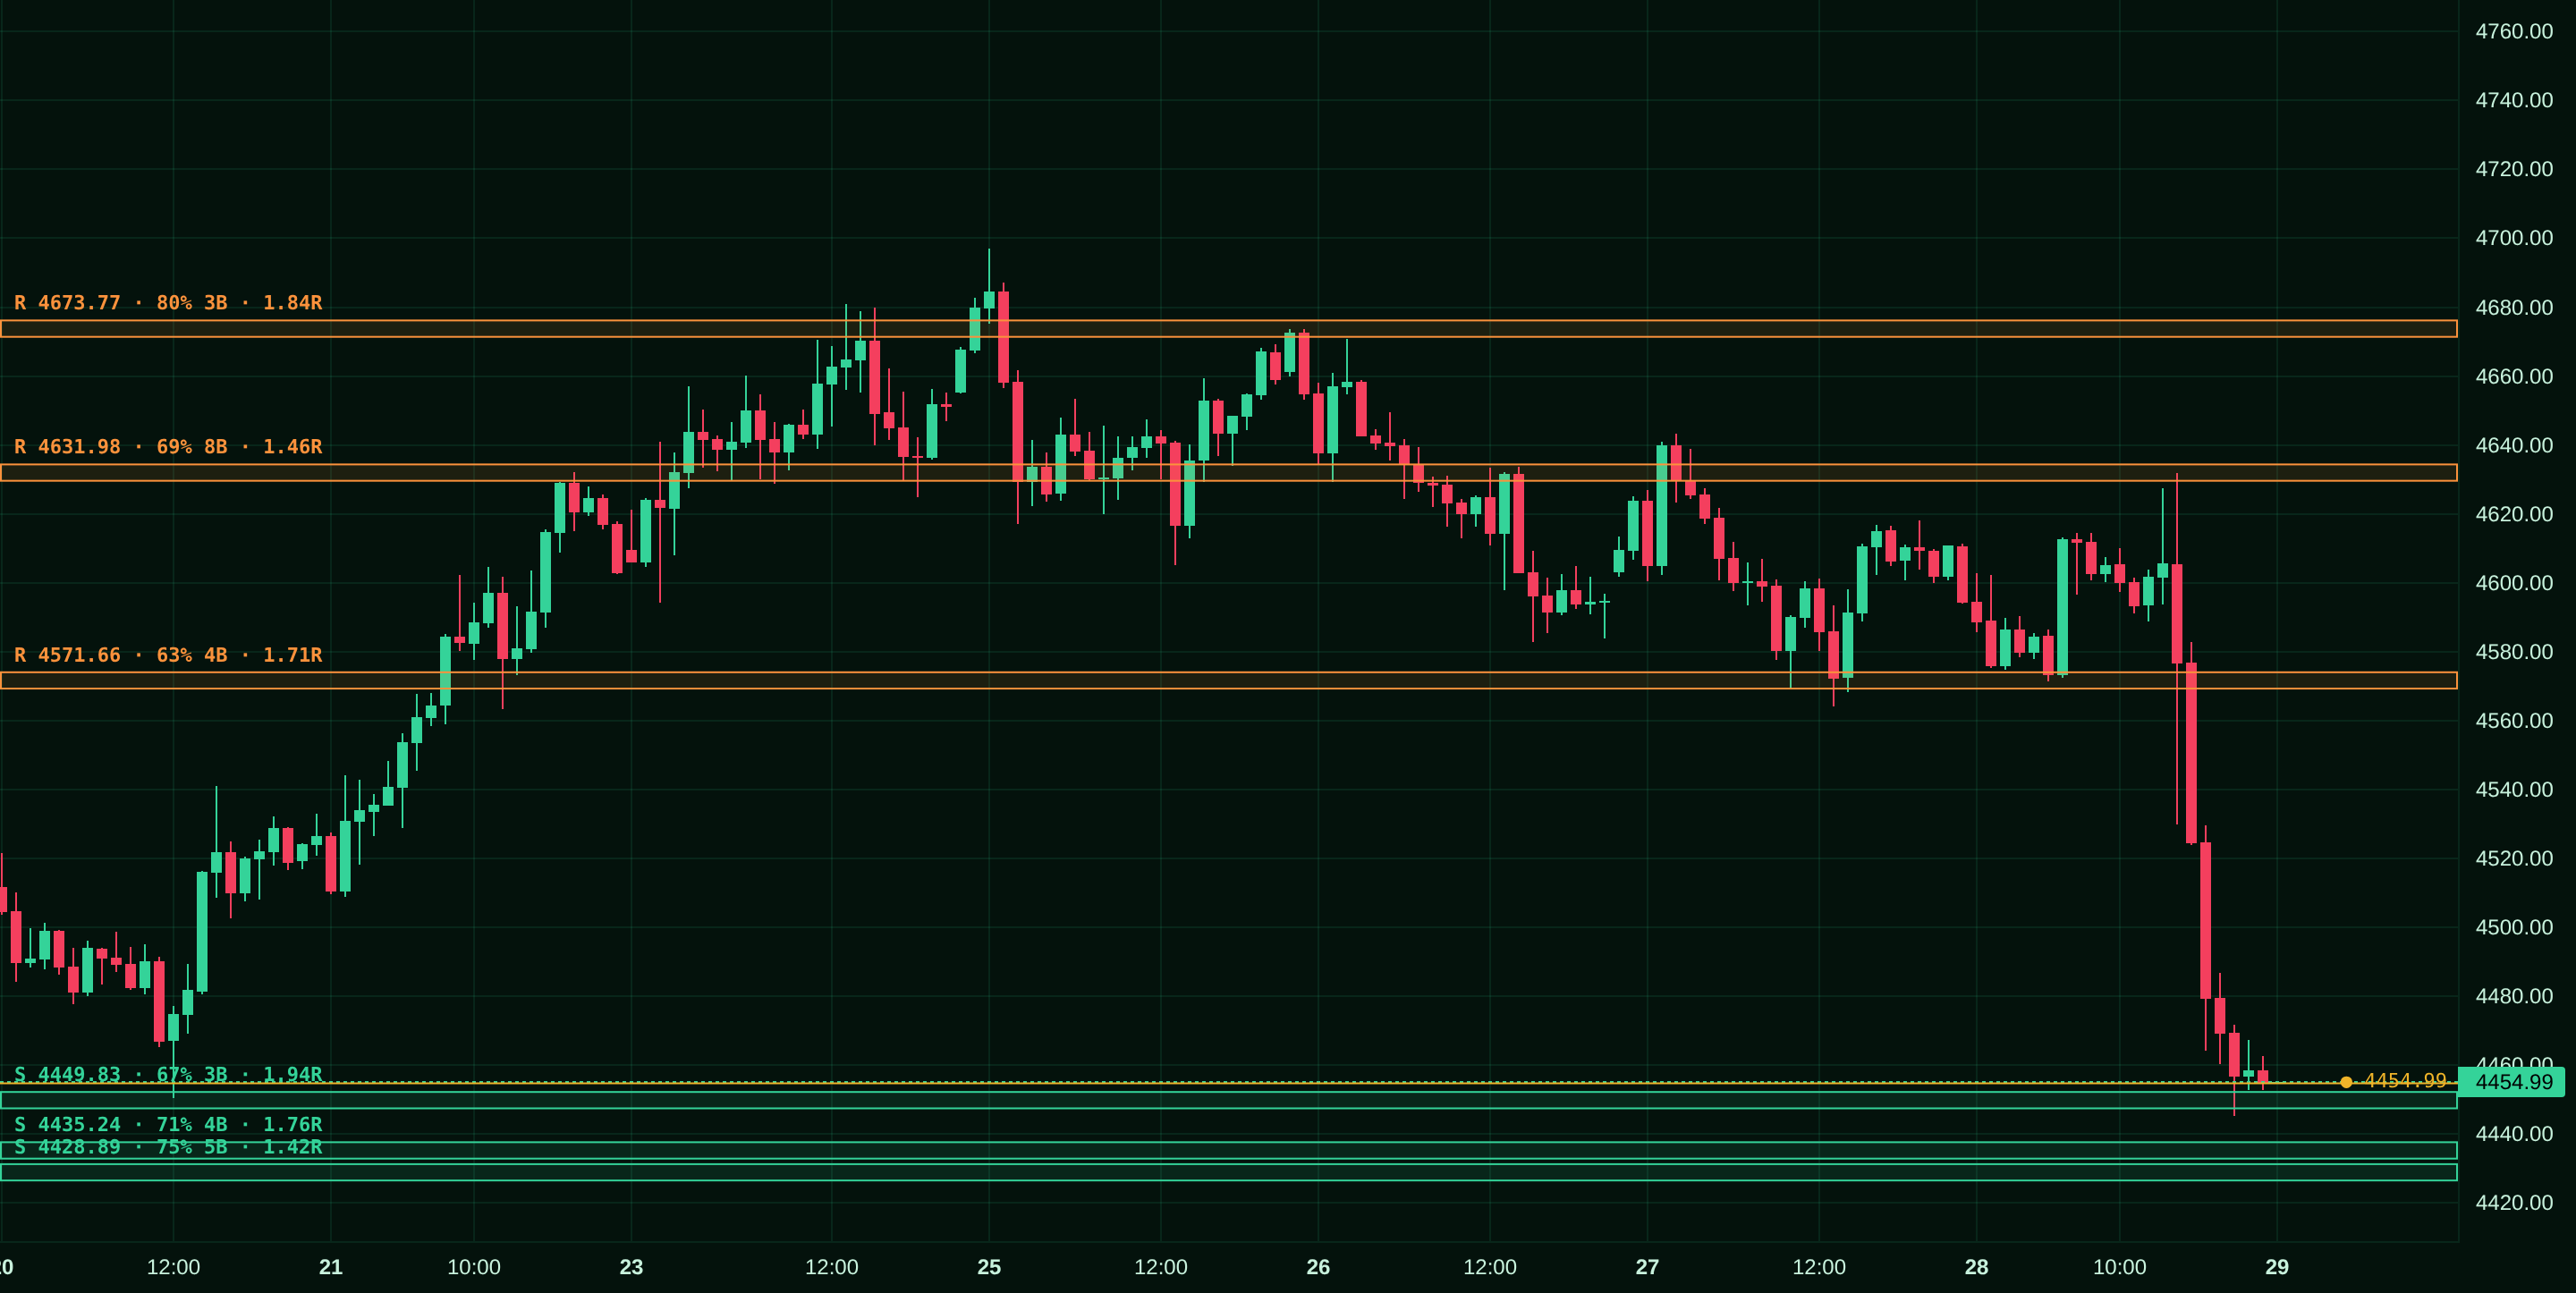
The live XAU/USD spot price with technical-analysis overlays drawn on the candles: order blocks, supply and demand, market structure and liquidity. 30+ tools, M1 to D1. Free access for members.

XAUUSD · H1 · live market-structure levels $4,098.96 live
XAUUSD live chart with supply and demand zones, support and resistance and market structure
SUPPLY & DEMAND
Zones on the chart
STRUCTURE
BOS / CHoCH

Open the live chart →

XAU/USD … BID … ASK … SPREAD … ● LIVE TIMEFRAMES M1 to D1 TOOLS 30+ COST FREE
How it works

Open it. Read it. Plan it.

The chart does the reading, you make the call.

STEP 01

Read the market

Open the live XAUUSD chart and see price action with smart-money zones and structure already drawn on the candles.

STEP 02

Spot the levels

Supply, demand, support and resistance come scored and ranked, so you know which levels actually matter.

STEP 03

Plan the trade

Drop trendlines, Fibonacci and risk-to-reward straight on the chart. Your markups save on your device.

STEP 04

Track it live

The price ticks in real time and levels update on every closed bar, so nothing repaints behind you.

The full toolkit

Tools that read gold as fast as you think.

Not just candles. The market-structure and liquidity layers that matter, and you can toggle any of them on or off.

Smart Money

Order BlocksSupply & DemandFair Value GapsLiquidity SweepsBreaker / FlipSmart ZonesUnicorn

Market Structure

BOS / CHoCHMSS (Market Structure Shift)HH / HLInternal Structure1-2-3 PatternsElliottTrendlinesChannels

Key Levels

Support / ResistanceFibonacciHead Shot PivotsZone MasterLiquidity MapZONES-XDoji Zones

Sessions & Flow

KillzonesSession BoxesEnergy / DisplacementWhales IndexSMT DivergenceOrder-Flow Proxy

Indicators

SMA / EMAVWAPVolumeVolume ProfileLinear RegressionVSA / Effort

Drawing & More

TrendlineRectangleRisk : RewardFib ToolTextZone Alerts13 ThemesScreenshot
7
Timeframes (M1 to D1)
30+
Analysis tools
Live
Real-time price
Free
Members access
Learn

Gold charting guides

Short, plain-English guides to reading XAUUSD price action and market structure.

Background

What is XAUUSD?

XAUUSD is the price of one troy ounce of gold quoted in US dollars. XAU is the symbol for gold; USD is the US dollar. When the number rises, gold is strengthening against the dollar; when it falls, the dollar is gaining on gold. It is one of the most traded instruments in the world, moving on interest rates, inflation, the dollar and risk sentiment.

This page gives you a members-only, real-time XAUUSD chart (free access via our WhatsApp group) with the analysis most retail charts leave out. Instead of plain candles, it marks the zones and levels that tend to matter, and updates them on every closed bar, so what you see is what the market actually printed. New here? Start with what is XAUUSD or how to read a gold chart.

It is a reading and study tool. It shows structure and levels clearly so you can make your own decisions. It does not place trades, and nothing here is a signal to buy or sell.

Questions

Frequently asked

Is the gold price real-time?

Yes. The XAUUSD price updates continuously from a real-time feed, and the forming candle grows live between closed bars.

Is the live chart free? Do I need an account?

The guides, blog and economic calendar are free and open to everyone. The live interactive chart is members-only: join our WhatsApp group to get free access, then log in.

Which timeframes are available?

M1, M5, M15, M30, H1, H4 and D1, switchable instantly, with higher-timeframe zones projected down.

What do the zones and levels mean?

Green marks demand and support, orange marks supply and resistance, each with a reliability score. Order blocks and structure shifts (BOS/CHoCH) confirm on candle close, so nothing repaints.

Does it work on mobile?

Yes. The chart and every tool are built to work on phones, with a scrollable toolbar and touch drawing.

Is this financial advice?

No. It is a charting and study tool for educational use only. It does not give signals or place trades, and it is not investment advice.

Who is behind XAUUSD Live Chart?

The site was founded and built by Meer, Muhammad Aamir Iqbal, known to many traders as Sultan of Multan: 14 years trading gold, 22 years in software and marketing. He created GMC, the Gold Market Concept, which the live chart implements, built on a machine-learning study of 26 years of one-minute gold data and his model of the four whales that move gold. See the Who We Are page.
Economic Calendar

The news that moves gold

This week's US dollar (USD) releases only, in your local time: the news that actually moves gold.

High Medium Low F Forecast · P Previous · A Actual
Full economic calendar →
Mobile App

Get the XAUUSD chart as an app

Install the free app on your phone or desktop: the full live chart and calendar, one tap from your home screen. No app store, installs in a second.

📱 Download App

Android / Desktop: tap the button · iPhone: open in Safari → Share → Add to Home Screen

Founder

Built by a gold trader, not a software vendor

XAUUSD Live Chart is the work of Meer, Muhammad Aamir Iqbal, known to many traders as Sultan of Multan: 14 years trading gold, 22 years building software and marketing. The chart runs on GMC, the Gold Market Concept, his own framework for reading XAUUSD: 26 years of gold data studied minute by minute, the gold frequency, and the four whales that move the market. The SMC, ICT and VSA courses on this site are free.

Who we are → Free courses →
Ready

See gold the way it actually trades.

Open the live XAUUSD chart: real-time price, market-structure zones and liquidity, all in one window.

Open Live Chart →
×Gold price ya broker ke baare mein poochho — ask in English or Urdu.
Join Group